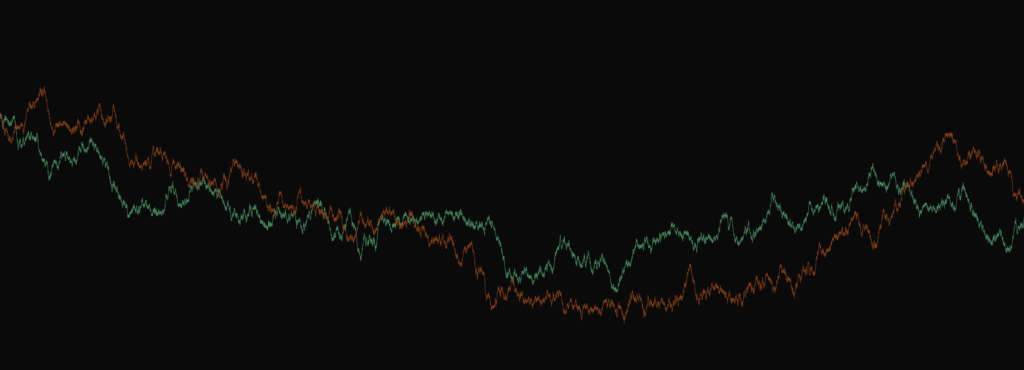
Simple 2D chart.

Supercharge your Ignition charting and trending capabilities

In a traditional Ignition chart, we often see performance issues, limited features, basic visuals, and slow update times. These charts struggle with slow rendering and lag, especially when handling large datasets, and lack advanced features like complex overlays, customizable gradients, and drawing tools. The visuals are often standard and uninspiring, making data interpretation challenging. On top of it all, significant delays in real-time data updates can hinder timely decision-making.

read the manuals

Superior Performance

Lightning-fast rendering: Handle even the largest datasets effortlessly with an optimized engine.

Instantaneous updates: Achieve real-time data updates without lag, ensuring you always work with the latest information.


Rich Feature Set

Complex overlays: Add multiple data series, trend lines, and custom annotations to your charts.

Drawing tools: Utilize advanced drawing tools for creating measurement lines and markers, directly on your charts.

Gradient customization: Apply sophisticated gradient fills to your data series, increasing visual appeal and clarity.

Enhanced Visuals

2D capabilities: Choose from a wide variety of 2D to chart types to best represent your data.

Highly customizable: Tailor every aspect of your charts, from colors and themes to axis labels and legend placements.


Unleash the power of advanced charting for US$5,500